| Provider | Waiting list |
Waiting: median (wks) |
Actual wait for operation (median wks) |
Actual wait for clinic treatment (median wks) |
Within 18 wks |
52+ wk waits | 52+ wk share |
Waiting for operation (%) |
Patients recommend (FFT) |
CQC rating |
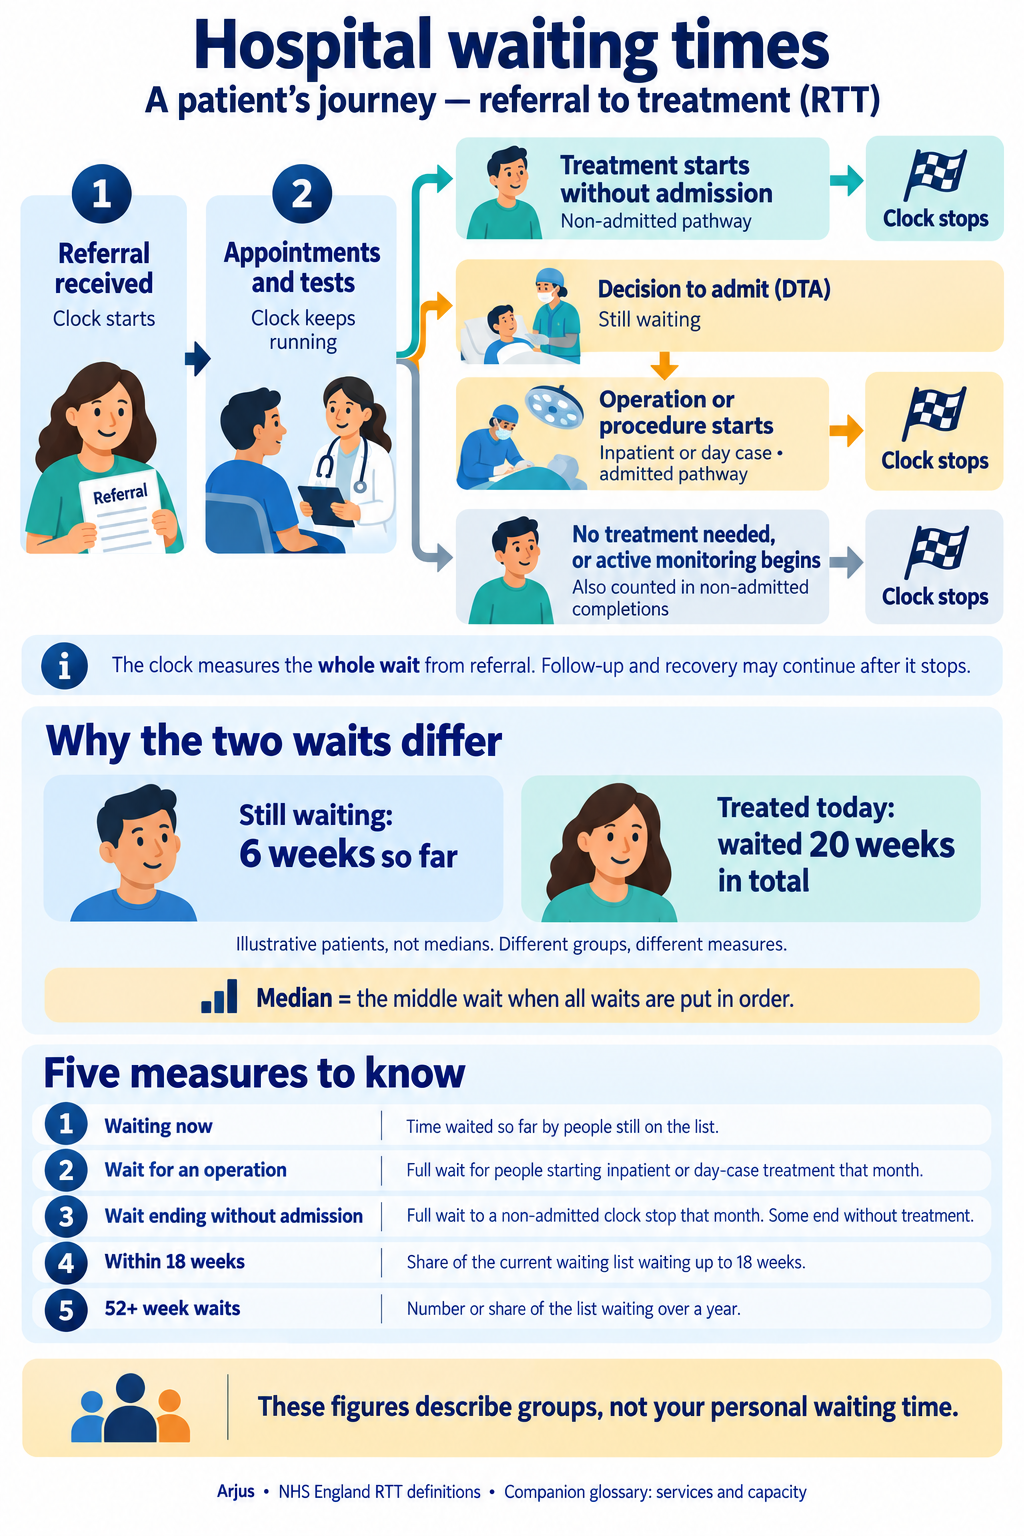
Providers with a waiting list of at least 100 pathways for the chosen specialty. Includes independent-sector providers treating NHS patients. Click a row to drill into that provider. “Waiting” medians are the wait so far of patients still on the list — up to date, but they run low because most joined recently. “Actual wait” columns are the full waits of patients whose treatment started in the month — the honest expectation, but backward-looking and volatile for small units. Admitted waits (operations and day-case procedures) are usually longer than non-admitted waits (treatment in clinic); use the one that matches your patient’s likely pathway. Providers without the chosen measure sort last and drop out of the chart. The ranking defaults to the operation wait for surgical specialties and the clinic wait for medical ones — use the Rank by buttons to switch. A ⚠ marks a provider or specialty whose actual waits are 10 or more weeks shorter than the waits of patients still on its list — usually a sign that recent referrals are treated quickly while an older group waits, so the actual wait understates what a new patient faces.
The waiting list counts incomplete consultant-led pathways at each month end, split by wait so far. The NHS constitutional standard is 92% of the waiting list within 18 weeks.
| Specialty | Waiting list |
Waiting: median (wks) |
Actual wait for operation (median wks) |
Actual wait for clinic treatment (median wks) |
Within 18 wks |
52+ wk waits | 52+ wk share |
Consultant FTE | Completed ÷ FTE |
Treatment functions as reported in the RTT collection; “Other” groups cover services without a dedicated code (including paediatrics and mental health). “Waiting” medians are the wait so far of patients still on the list — dominated by recent joiners. “Actual wait” columns are the full waits of patients whose treatment started in the month, so they better reflect what patients experience. Admitted waits (operations and day-case procedures) are usually longer than non-admitted waits (treatment in clinic); use the one that matches your patient’s likely pathway. A ⚠ marks a provider or specialty whose actual waits are 10 or more weeks shorter than the waits of patients still on its list — usually a sign that recent referrals are treated quickly while an older group waits, so the actual wait understates what a new patient faces.
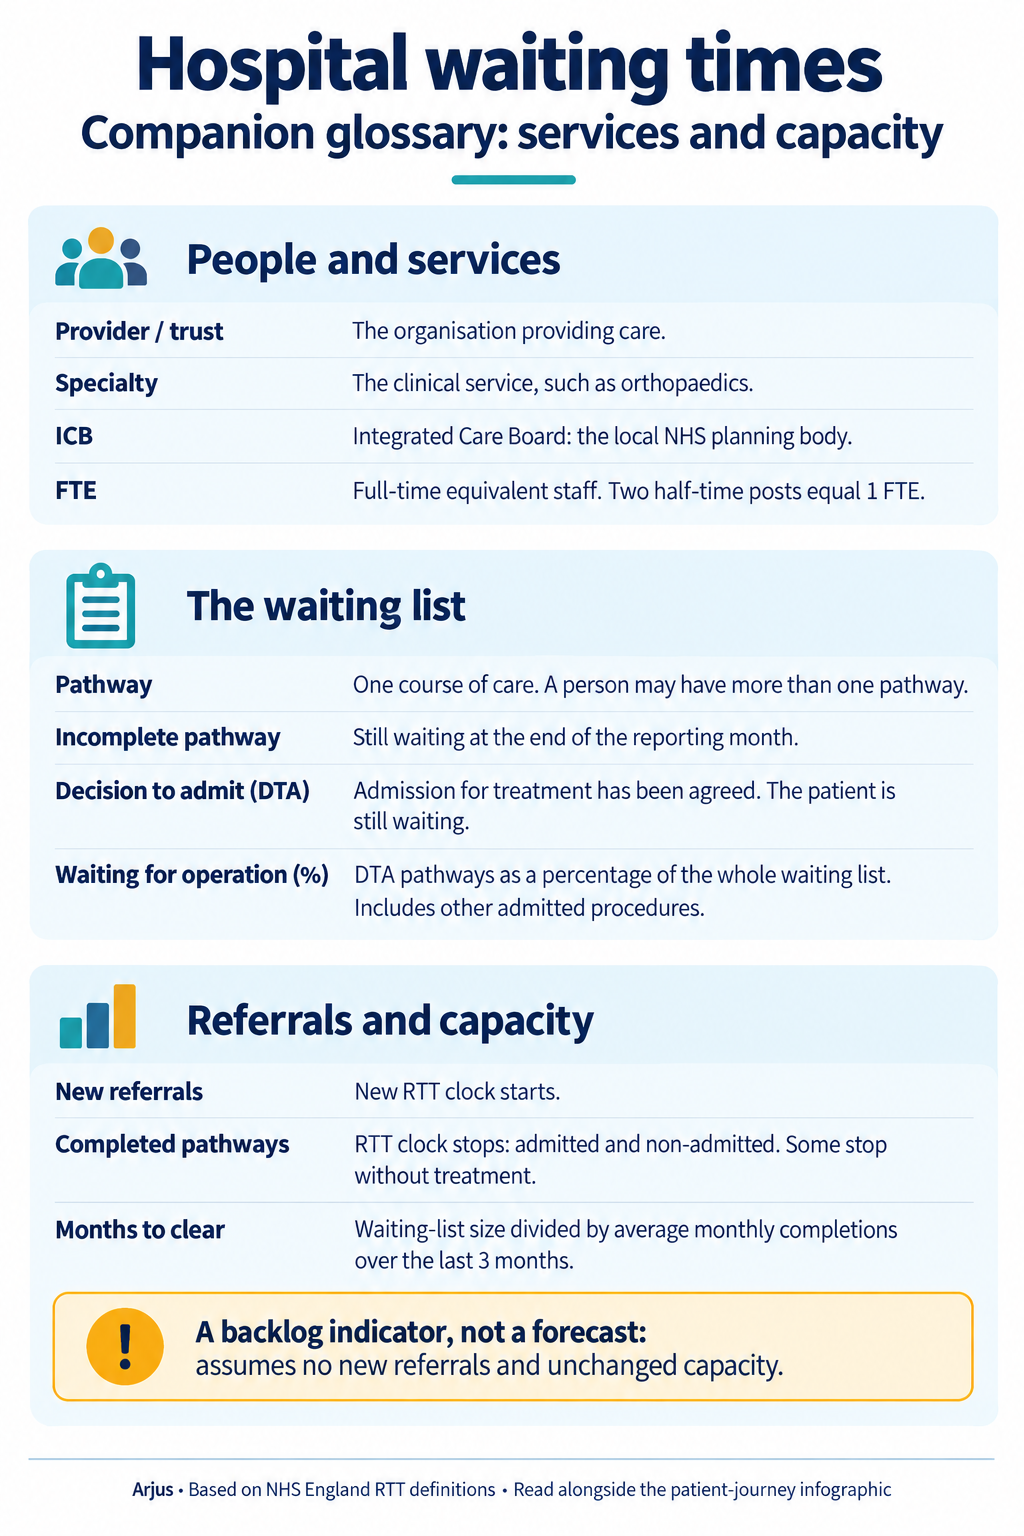
New RTT periods are clock starts (referrals entering the pathway); completed pathways are admitted plus non-admitted treatment starts. Months-to-clear divides the waiting list by the trailing 3-month average of completed pathways — a size-of-backlog indicator, not a forecast: it assumes no new referrals and unchanged capacity.
| Provider |
Appointments attended |
Missed by patient |
Cancelled by hospital |
Waited over 3 months after GP referral |
Wait after GP referral (median wks) |
Follow-ups per first appointment |
By phone or video |
Discharged at first appointment |
First appointments from GP referrals |
Source: NHS England, Hospital Outpatient Activity (Hospital Episode Statistics), provider-level analysis — published once a year for the financial year (April to March), all specialties together, so the Specialty and Month pickers above do not change this tab. It counts appointments, not people. “Missed by patient” is missed ÷ (attended + missed). The wait after GP referral runs from the date the hospital received the referral to the first appointment attended. Same-day appointments are left out of every wait figure on this tab, because they are mostly same-day assessment clinics or referral dates recorded on the day and not a real wait. The source does not say which referrals were urgent, so urgent and two-week-wait referrals cannot be removed and are still included — a routine referral will usually wait longer than the median shown. The median is estimated from the published wait bands (the published median includes same-day appointments) and is shown in weeks to match the other tabs; it is not the RTT wait to treatment shown there. Some providers do not submit cancelled or missed appointments (shown as a dash), which also pulls the England cancellation figure down a little. ICB figures add up the providers listed here and leave out community and mental-health trusts that are not in the RTT collection; Provider counts are rounded to the nearest 5 and very small numbers are hidden. Trust mergers change year-on-year totals.
| Provider |
Waiting for a test |
Waiting over 6 weeks |
Waiting over 13 weeks |
Wait so far (median wks) |
Tests done in the month |
Source: NHS England, Monthly Diagnostic Waiting Times and Activity (the DM01 return), provider level, covering 15 key tests. The Specialty picker above does not apply; use the Test picker on this tab. The NHS standard is that fewer than 1% of people should wait more than 6 weeks for a diagnostic test. Waits are the wait so far of people still waiting at the month end; the median is estimated from weekly bands and capped at 13 weeks. ICB figures add up the providers shown and leave out a small number of community providers that are not in the RTT collection (about 3% of waits). Click a row to drill into that provider.
| Provider |
Diagnosis within 28 days |
Patients (28-day) |
Treatment within 62 days |
Patients (62-day) |
Treatment within 31 days |
Patients (31-day) |
Source: NHS England, Cancer Waiting Times, monthly provider-based data. The Specialty picker above does not apply to this tab. The three standards are: told whether or not you have cancer within 28 days of an urgent referral (75%); first treatment within 62 days of an urgent referral, screening or consultant upgrade (85%); and treatment within 31 days of the decision to treat (96%). Recent months are provisional and are revised later. The breakdown by cancer type pools the latest three months, because single months are small numbers for one trust; types with fewer than 5 patients are left out. For the 62-day standard a patient shared between two trusts counts as half for each. ICB figures add up the providers shown. Click a row to drill into that provider.